Scenario Results Viewer
The scenario results viewer can be used to view charts and maps of population and habitat outputs from the simulations.
Viewing ouputs
Two options exist for adding output layers for viewing: review and compare.
- Review is used to view one or more indicators from a single simulation. When review is selected you are asked to specify the Herd, Season, and Scenario, and to Add one or more indicators
- Compare is used to compare indicators from two simulations. When compare is selected you are asked to specify the Herd, Season, and Dataset (i.e., indicator), and then to identify the two scenarios to compare
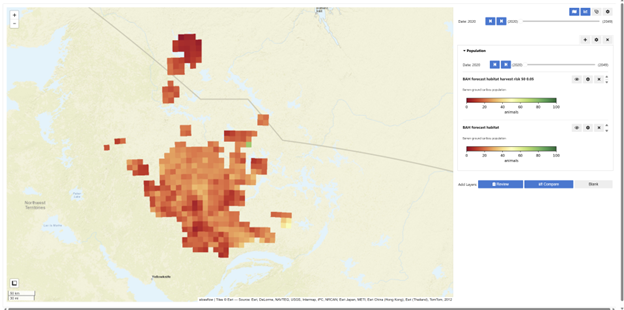
Once outputs are added, the map and graph icons in the top right are used to switch between map and chart views. The time slider is used to change the simulation year that is being viewed.
Settings for maps and charts are set by clicking the gear icon to the right of the indicator name in the right panel. Some of the settings that are available include: whether the Chart Data should be presented in the chart as a mean, sum, maximum, minimum, or standard deviation; the Min and Max values in the colour ramp used for a map; and the colours used in the colour ramp.
Maps or chart lines can be hidden by clicking the eye icon to the right of the indicator name in the right panel. This is a convenient way to toggle between layers or chart lines.
Clicking the icon in the top right of a page with an arrow will allow you to export maps and charts that are currently open in the results viewer. Specify a name for the figure export and the email address that the figures should be sent to once they are prepared.
Available indicators
Indicators that can be viewed are:
1) Habitat index - a 0 to 1 value, with 1 representing maximum habitat availability. Calculated using resource selection functions developed from caribou collar data. The covariates that are used in the calculation of the habitat index are also included. The covariates are the indicators that start with “Landscape - …”.
2) Population - the number of caribou within each 100 km2 raster.
3) Carrying capacity - the maximum population that can be supported by a raster based on habitat availability.
4) Deaths - the number of caribou deaths per raster. Five Deaths indicators are available: Total and deaths by each of four types. “Deaths – Harvest” are deaths modeled in response to the “Number of Animals Harvested” section of the Scenario Analysis Tool. “Deaths – Additional Harvest Near Footprint” are deaths modeled in response to the “Caribou Harvest Near Development Footprint” section of the Scenario Analysis Tool. “Deaths – Density Dependent” are deaths that start occurring when population density starts approach carrying capacity. “Deaths – Natural” are deaths based on natural mortality rates specified in the “Scenario Analysis Tool”, including deaths resulting from relationships with climate and footprint encounters. Intermediate indicators that are used in the application of the climate-mortality relationships are also available, including the climate attributes (Average Summer Temperature, Average Winter Temperature, Average Winter Snow Depth) and the adjustment in calf mortality that is applied in response to the climate relationships (Average Summer Temperature Mortality Adjustment, etc.).
5) Births - the number of caribou births per raster. Offspring equals 0 in all seasons except for the calving season.
6) Number of encounters – the number of days that a caribou spends, on average, within the footprint zone of influence during a season. The footprint ZOI buffers are those specified in the “Footprint Encounters” section of the Scenario Analysis Tool.
7) Proportion of habitat displaced – the proportion of habitat occurring within the footprint ZOI buffers specified in the “Avoidance of Development Footprint by Caribou” section of the Scenario Analysis Tool.
8) Proportion of habitat exposed to harvest – the proportion of habitat occurring within the buffers specified in the “Caribou Harvest Near Development Footprint” section of the Scenario Analysis Tool.
As described in the Scenario Analysis Tool documentation, the user has the option of running simulations that do not include population dynamics. If population dynamics are not run, the indicators generated by CBGC ALCES are limited to the following: habitat index and associated landscape covariates, number of encounters, proportion of habitat displaced, and proportion of habitat exposed to harvest.
Analyst and public versions
Two versions of the results viewer are available: 1) The analyst version, which is available to users with password access to the full NWT-CBGC model. The analyst version can be used to view all scenarios simulated using the model 2) A public version that can be used to view scenarios that were set to public in the simulation settings. The public version does not require an account to access.